Friday, August 2, 2013

What the Hail is Going On?

 ***Repost***

Between 2005 and 2007, there was much discussion before changing the severe thunderstorm criteria for hail from 3/4-of-an-inch diameter to 1-inch diameter, or from the size of a penny to a size of a quarter.  It doesn't seem that much of a change, but it is considering that damage to a house from hail starts somewhere around 1 1/4-of-an-inch in diameter.
Also, it was thought that Severe Thunderstorm warnings issued by local National Weather Service Offices were quite numerous and that by forecasting for the slightly larger hail, there wouldn't be so many severe thunderstorm warnings issued during the spring and summer months.
The graph below shows the difference in the number of hail reports annually since 1955 through 2012.  Outside of the years before 1996, the number of 3/4-inch hail reports outnumbered 1-inch hail reports until 2007.
Hail55-12
Annual number of 3/4-inch and 1-inch hail 1955-2012.
Coincidentally, verification was done at the old National Severe Storms Forecast Center prior to 1996 before being relocated in Silver Spring, MD.  It was 2007 that the NWS changed the severe criteria to 1-inch diameter hail.  It is seen that in the modern era (which is defined from 1990 on with the operation of Doppler radar) 1-inch diameter hail has been out-reporting 3/4-inch hail since 2009.  This could be due more to that offices are not logging non-severe hail.  Around 70% of all hail reports are now 1-inch diameter or better where prior to 2009 it was around 47%.
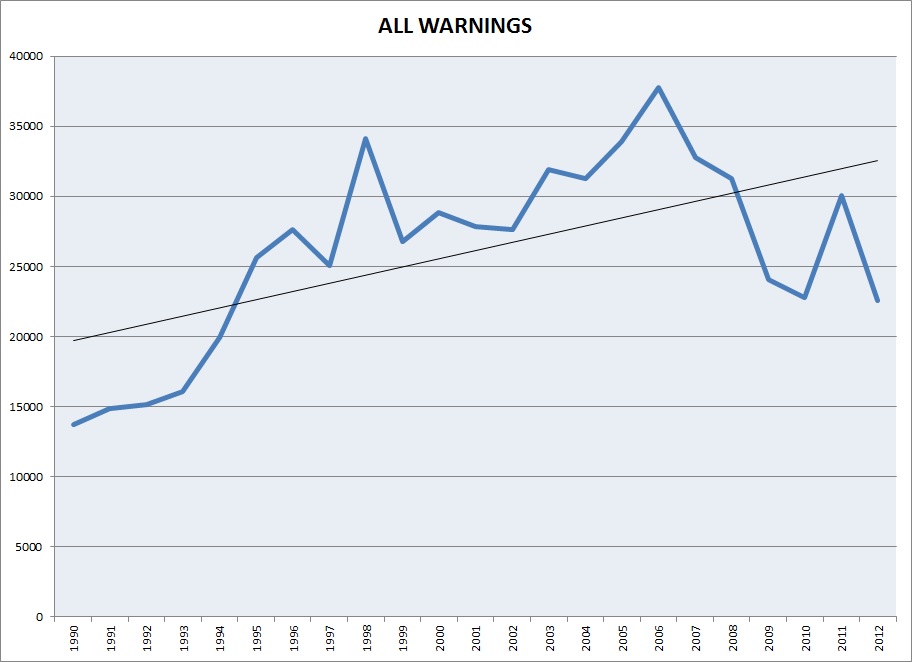
Does the change in hail criteria change the number of warnings issued nationwide?  Let's look at a plot, first, of total warnings since 1990.  We'll look at combined tornado and severe thunderstorm warnings since there is not a specific designation for hail warnings.
Warnings_1990to2012
Plot of combined tornado and severe thunderstorm warnings during the modern era 1990-2012. Black line is the trendline.
During the modern era, warnings have increased 167% from 1990 through 2012.  Much of this may be attributed to the installation of Doppler radar and trained weather spotters across the country.  From 1990 through September, 2007, the NWS office issued county-based warnings.  It was in October 2007 that polygon, or storm-based warnings were verified.
Warnings_2007to2012
Number of severe thunderstorm warnings from 2007 through 2012.
The plot above considers combined warnings from 2007 through 2012.  Again, in October 2007, storm-based warnings were verified.  This shows a decrease of 38% of warnings issued nationwide.
This could lead to the conclusion that changing the severe criteria to 1-inch diameter hail did decrease the number of warnings.  But, one must consider that 2011 was an unusually active year for tornadoes and severe storms.  Plus, damaging winds also plays a role in the issuance of severe thunderstorm warnings.  Convective winds of 50 kt (58 mph) or better meets severe criteria, as does wind damage.  Damage to large trees and outbuildings makes for a large array of considerations to issue severe thunderstorm warnings.

Monday, July 1, 2013

More on the Changes with the F/EF-Scale

     My previous blog talked about the distribution of tornado damage using the F/EF-Scale.  The main point here was how in the modern era (1990-2012) the distribution of violent damage was slow low (0.62%) after the occurrence of two tornadoes in Oklahoma where the damage was labeled EF5.  The tornado damage in Moore, OK after the May 20, 2013 tornado was based on the damage observed, while the El Reno, OK tornado was decided based on damage, but weighted by the measured wind speed using the phased-array radar on a Doppler on Wheels estimated the tornado produced 262 mph winds.  Note: the EF5 wind estimates are listed at 205+ mph.  Thus, the debate was on as two different methods were used to come to the damage rating.

     So, adding to this information and the previous blog, below is the fatalities by F/EF-Scale ratings of tornadoes during the modern era:

Fatalities 1990-2012 associated with F/EF Scale damage ratings.
    So, while the modern era still shows that 0.62% of violent tornadoes (EF4 or EF5), this type of destruction is associated to 61% of the fatalities.

     Let's look at the violent tornado months of April and May, 2011 which were the most active tornado months since 1953.  These months had 1084 tornadoes that resulted in 538 fatalities (see below).


These months included the tornado outbreaks that occurred over MS, AL and parts of GA April 27-29, and also the Joplin, MO tornado of May 22, 2011.  The damage in Joplin was rated as EF5 and resulted in 158 fatalities.

   During the months of April and May 2013, only 2% of the tornado damage was rated EF4 or EF5 (22 of the 1,084 tornadoes reported)


But, these tornadoes were attributed to 83.5% of the fatalities during these months!  This is an alarming figure considering how well-warned people were during many of these events.  Notice that 0.55% of the tornado


damage rated EF5 was linked to 53.5% of the tornado-related deaths!  And, by well-warned, there were moderate and high risks for severe weather issued by the NOAA Storm Prediction Center including several days of highlighted information days in advance, and many NWS Weather Forecast Offices issued hundreds and hundreds of warnings in association with these events.

So, how does this data and the previous data show any change between the F-Scale and EF-Scale?  We have much smaller numbers for EF5 damage than we used to.  We always stated that 1% of all tornadoes were rated the totally damaged EF5.  During the modern era, we have reduced that for the most part, and it's even less when you put aside the 2011 tornado year.  In 2013, we know of 2 tornadoes with EF5 damage: Moore, OK on May 20th and El Reno, OK on May 31st.  Assuming there are 1200 tornadoes on average, that is still 0.01% of all tornadoes that will still play a majority of the tornado fatalities.

Friday, June 21, 2013

Changes in the F/EF Scale in the Modern Era

I just posted the following graphic on Facebook:


I was interested in seeing how tornado damage has changed in the modern era defined as 1990-2012, the years that Doppler radar has been used for warning on severe thunderstorms that can or have produced tornadoes.  It's interesting to see that the tornado damage of EF5 was used 18 times since 1990.  Now, I need to put a little asterisk here seeing that the National Weather Service has only used the Enhanced Fujita Scale since February 2007, with the damage from the Greensburg, KS tornado being the first EF5.  So, actually, out of those 18 F5/EF5 damage tornadoes, only 8 tornadoes carry the illustrious EF5 moniker, while the others were rated F5 damage.

Now, F5 and EF5 are supposed to be similar ratings in order to protect the climatological record.  The F-Scale is a 1/4-mile wind originally used by Fujita (1971), while the EF-Scale is a 3-sec wind.  If you want all the juicy details see the Storm Prediction site at spc.noaa.gov/efscale.  

The EF-Scale is to take into consideration structural integrity and lately there has been discussion whether the Joplin tornado was worthy of the EF5 designation, see Mike Smith's blog here.  The fact remains that the EF-Scale, like its father, the F-Scale is subjective and carries an error of +/-1.  In most areas, this may seem trivial, but scientifically can mean the difference in an accurate database.

Now, for comparison, let's look at how the F-Scale faired from 1972-1989, prior to Doppler radar being widely used:


Note that from the inception of the F-Scale, which was widely used to survey the Super Outbreak of April 3-4, 1974, really for the first time, 0.10% of all tornado damage was rated F5.  Compare that to the modern era of 0.06% being rated F5/EF5 and it is pretty comparable, and this dataset includes Super Outbreak II that occurred April 24-28, 2011.